2013-2014 Regular season
Results
The following teams are in this competition:
| plg_Name | pct | W | L | avg(Nrtg) | avg(Ortg) | avg(Drtg) | |
|---|---|---|---|---|---|---|---|
| 1 | GasTerra Flames | 0.89 | 32.00 | 4.00 | 24.81 | 110.47 | 85.67 |
| 2 | Dukes Unlimited | 0.81 | 29.00 | 7.00 | 19.04 | 113.95 | 94.91 |
| 3 | Den Helder Kings Noordkop | 0.67 | 24.00 | 12.00 | 8.81 | 111.28 | 102.47 |
| 4 | BS Leiden | 0.61 | 22.00 | 14.00 | 10.15 | 105.80 | 95.65 |
| 5 | Landstede Basketbal | 0.61 | 22.00 | 14.00 | 9.03 | 106.17 | 97.14 |
| 6 | Matrixx Magixx | 0.56 | 20.00 | 16.00 | 9.74 | 109.69 | 99.95 |
| 7 | BV Aris | 0.36 | 13.00 | 23.00 | -8.69 | 98.96 | 107.65 |
| 8 | BC APOLLO A’dam | 0.19 | 7.00 | 29.00 | -20.99 | 85.28 | 106.27 |
| 9 | Rotterdam Basketbal | 0.19 | 7.00 | 29.00 | -23.98 | 89.13 | 113.12 |
| 10 | Basketball Stars Weert | 0.11 | 4.00 | 32.00 | -27.91 | 85.04 | 112.94 |
Ratings
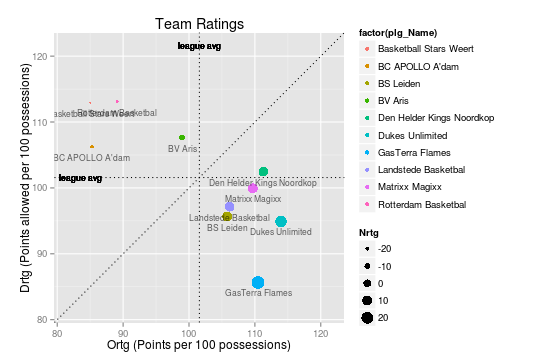
The average offensive and defensive ratings for all teams are pictured below, in the quadrant plot descibed by Kevin Pelton in [Pelton2012].
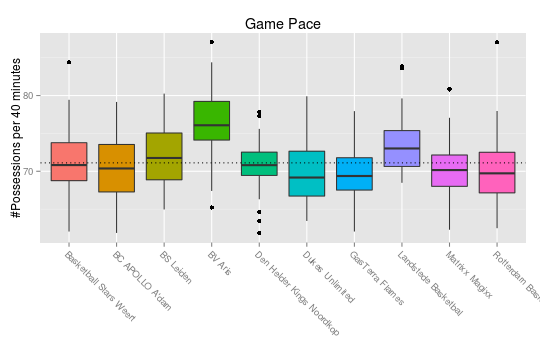
Pace
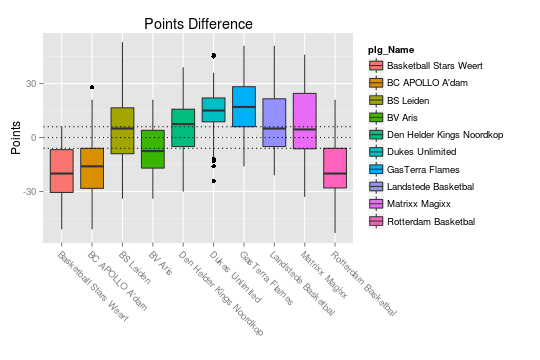
Points
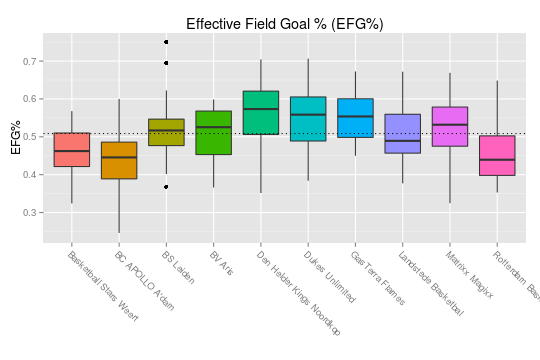
Four Factors
The net rating is plotted against all “four factors” for all games in this competition. These plots show us how each of the four factors influences the net rating. Because we can assume the net rating to be the best indicator of actually winning games, these plots show how and how strongly each of the four factors contribute to winning basketball games in the DBL in this season.
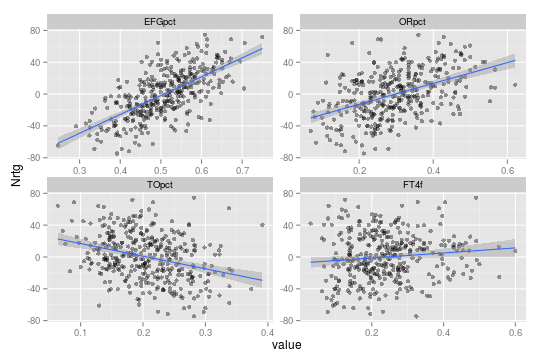
The correlation matrix for the four factors and the net rating is displayed below:
##           Nrtg   EFGpct      ORpct      TOpct      FT4f
## Nrtg    1.0000  0.65887  0.4582062 -0.3120832  0.109979
## EFGpct  0.6589  1.00000  0.1547019 -0.1104864  0.085672
## ORpct   0.4582  0.15470  1.0000000 -0.0001275 -0.001923
## TOpct  -0.3121 -0.11049 -0.0001275  1.0000000  0.094991
## FT4f    0.1100  0.08567 -0.0019231  0.0949910  1.000000
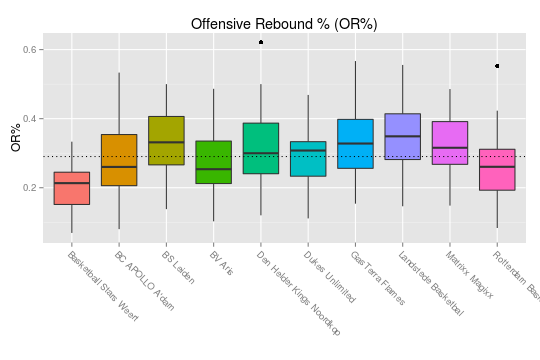
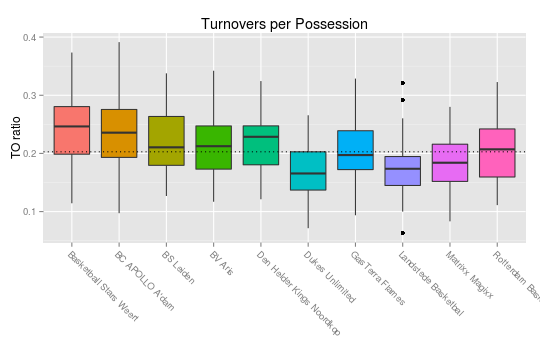
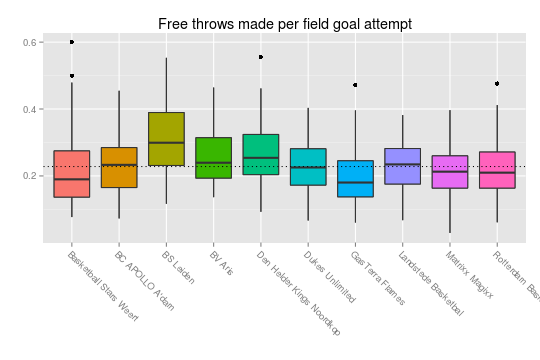
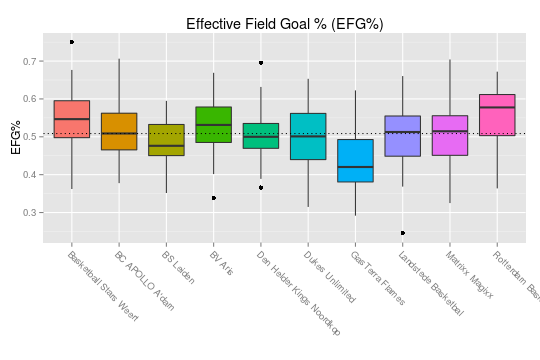
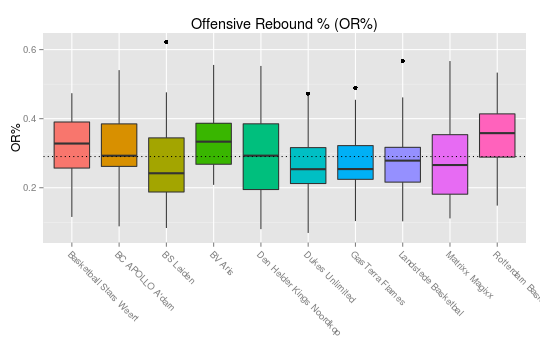
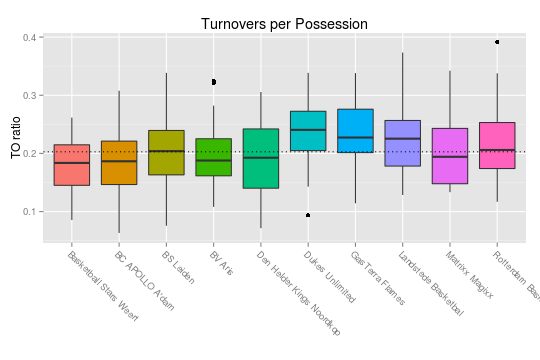
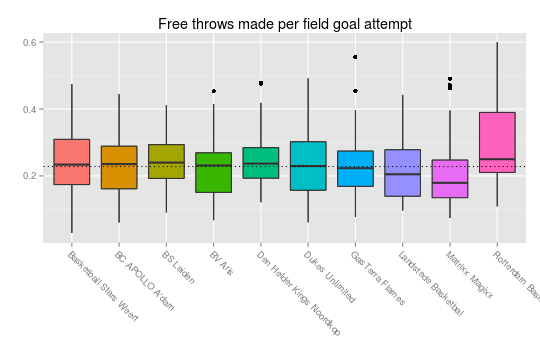
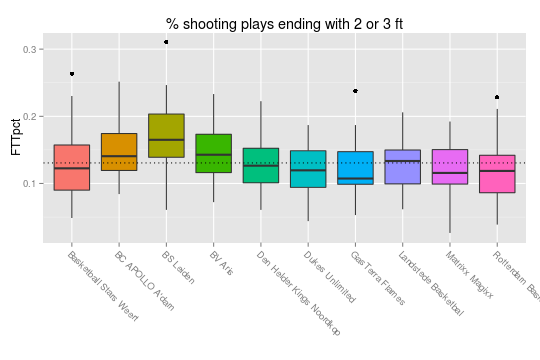
Offense
This shows the four factors for each of the teams.
Defense
This shows the four factors of the team’s opponents for each of the teams.
Shot selection
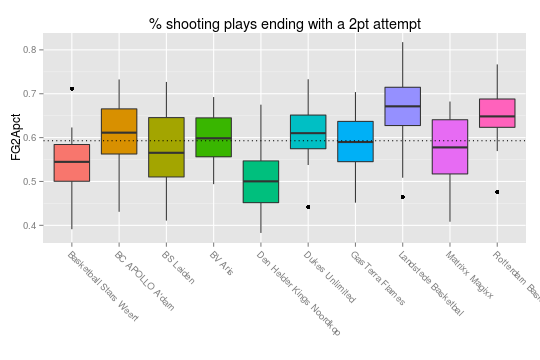
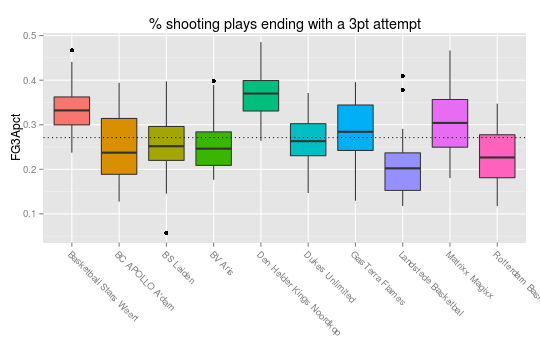
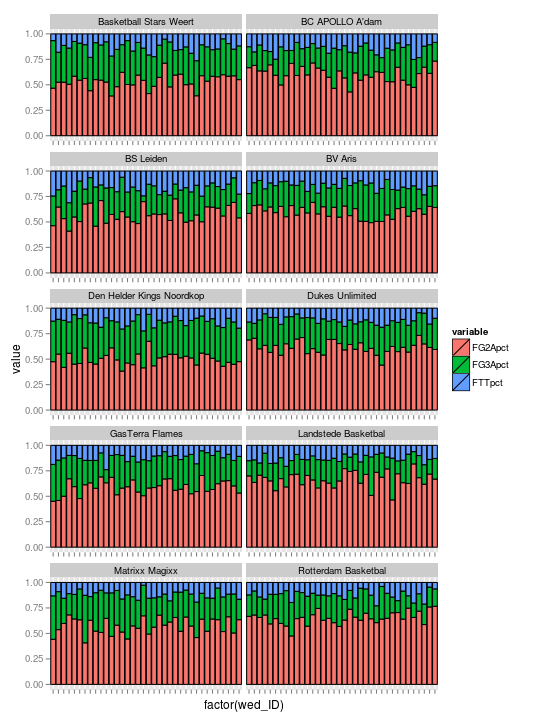
Todo
Add a header:
- date of last analyzed games
- number of games analyzed